In 1938 Hendrik Wade Bode, who worked at Bell Labs, published his asymptotic assessment of phase margin and gain margin, bearing his name [2]. The Bode plot is recognized for its simplicity and the simple asymptotic approach makes the method useful for both design and assessment of power system control loops. There have been many other methods introduced since, including Nathaniel Nichol’s stability charts in 1947 [4] and root locus introduced by Walter Evans in 1948 [5]. In 1974 R.D. Middlebrook introduced minor loop gain stability assessment as a method of assessing the stability of an input filter combined with the negative input resistance of a switching regulator [5].
During the early 1980s, Dean Venable popularized the Bode plot with the introduction of a low-cost frequency response analyzer (‘FRA’) that allowed power engineers to directly measure the phase margin using Bode plots. Since then, most power supply engineers have relied on the Bode plot for the assessment of stability. While there have been several articles discussing the shortfalls of the Bode plot, this article presents an excellent case study on the shortfalls, as well as a simpler alternative.[6]
‘Bode Plot Fail’ Case Study
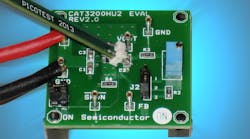
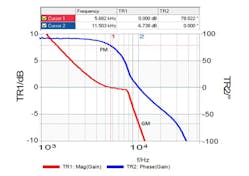
The Bode plot of a switching DC/DC converter, measured with the OMICRON Bode 100 VNA (Vector Network Analyzer), is shown in Fig. 1
A schematic diagram of the converter is not available; however the external sense connection allows the measurement of the Bode plot.
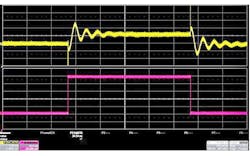
The phase margin of this converter is indicated as a very respectable 78 degrees and the gain margin, indicates a less than stellar, but acceptable 6.7 dB. Over the life of the converter, changes to tolerances could result in an unacceptable gain margin. A step load response of the converter is shown in Fig. 2.
While the Bode plot indicates a stable control loop, the step load response indicates significant ringing, indicative of poor stability. How could this be? This loops appears to be higher than 2nd order, likely due to a fourth order output filter. This results in a rapid phase loss and a near 0dB gain plateau beginning at approximately 5kHz.
Output Impedance To The Rescue
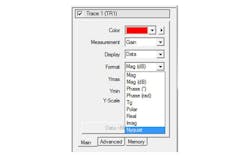
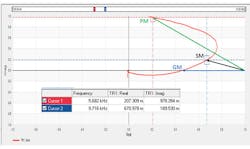
The Bode plot data is obtained for Fig. 1. The resulting Nyquist plot is shown in Fig. 4.
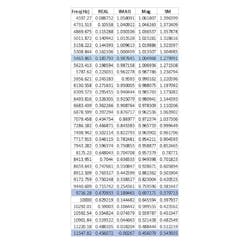
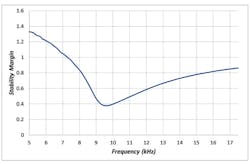
Three points are indicated on the Nyquist chart; phase margin, gain margin, and stability margin. The stability margin is defined as the closest distance between the singular unstable point (1,0) and the transfer function. If the curve touches the singular unstable point the circuit will oscillate. The raw data for this chart and a graph showing the distance from (1,0) at each frequency is shown in Fig. 4.
Three frequencies are highlighted in the raw data; the phase margin, indicated by the gain magnitude being unity (approximately 5464Hz), the gain margin indicated by the phase being 0 deg (approximately 11,548Hz) and the stability margin, represented by the smallest value of stability margin (approximately 9,716Hz). Looking back at the step load response, the ringing cycle period is seen to be approximately 100 µs and corresponds with the frequency of the stability margin.
We can calculate the phase margin from the raw data, by first confirming that the gain magnitude at 5464Hz is 1. Using the real and imaginary gain values the magnitude is calculated as:
The magnitude being equal to 1.0 confirms that this is the location of the phase margin. The phase margin can then be calculated from the real and imaginary gain terms as:
This agrees with the Bode plot cursor measurement. While it may seem contradictory for the Bode plot to report good stability while the stability margin is poor, this is a well-known phenomenon [6, 7]. In these cases, the stability margin generated by the Nyquist plot gives the correct assessment, while the Bode plot is in error.
The stability margin can be computed from the impedance vs. frequency response at the output of the regulator. The output impedance can be measured non-invasively, that is, without impacting the circuit operation. Non-invasive measurements have many advantages. [8]
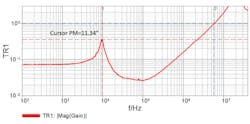
The unique Picotest mathematical software, included in the OMICRON Lab Bode 100 Vector Network Analyzer, transforms the cursor value in real time to a phase margin value. The impedance waveform, cursor, and stability margin measurement are shown in Fig. 6.
In this case, the stability margin is effectively 11.34 degrees. The peak impedance frequency of just under 10 kHz and agrees with the ringing frequency seen in the step load response.
The non-invasive impedance measurement is useful in many cases especially where a Bode plot cannot be measured, such as with voltage references and fixed voltage regulators that do not have an available control loop access point. It is useful for evaluating multiple loop converters and testing filter stability. The method also works well with high bandwidth op amps, where breaking the loop interferes with the measurement and in hi-reliability applications where it is not possible to cut a trace or wire to break the control loop.
Making it Even Simpler
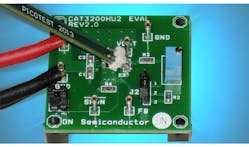
The non-invasive measurement is made even simpler by the use of a new high bandwidth 2-port ‘PDN’ probe, coming from Picotest in 2014. This probe allows a four-wire impedance measurement or the simultaneous injection and measurement of the step load performance using a single handheld fine point probe. The probe is designed to work with a 50 Ω vector network analyzer or 50 Ω time domain reflectometry equipment. The precision impedance control provided by the probe, combined with the SOLT calibration capabilities of an RF VNA, allow precise measurements even at low impedance levels often required for PDN assessments.
Five Things Every Engineer Should Know About Bode Plots
1. Bode Plots (phase margin/gain margin) are not always a reliable indicator of stability; in fact they can be downright misleading as in this case study.
2. Bode plots do not provide a measure of relative stability, but whether the circuit will oscillate or not. Stability margin does provide a relative stability assessment and coincides with the Q of the step load response.
3. Bode plots can have more than one phase margin and more than one gain margin. In these cases each of the margins applies to the stability assessment.
4. Bode plots work well for 2nd order systems, but not as well higher order systems. Stability margin works for higher order systems as well.
5. Bode plots became very popular because they can be easily sketched asymptotically and can be used to design stable loops as well as assess them.
References
1. H. Nyquist, Regeneration theory, BSTJ, vol. 11, pp. 126–147, 1932.
2. H. W. Bode, Variable equalizers, BSTJ, vol. 17, pp. 229-244, 1938.
3. N. Nichols, in Theory of Servomechanisms, H. M. James et al., Eds. New York, NY: McGraw-Hill, 1947.
4. W. R. Evans, Control System Dynamics, New York, NY: McGraw Hill, 1954.
5. R. D. Middlebrook, Input filter considerations in design and application of switching regulators, Proc. IEEE Industry
6. S.M. Sandler When Bode Plots Fail Us, Power Electronics, April 30, 2012 http://powerelectronics.com/power-electronics-systems/when-bode-plots-fail-us
7. M. Jones, Tale of the Bode Plot Failure, EEWeb.com Jan 29, 2011 http://www.eeweb.com/blog/mike_jones/tale-of-the-bode-plot-failure
8. S.M. Sandler Assessing POL Regulators Using Non-Invasive Techniques, Power Electronics Technology, October, 2012 http://powerelectronics.com/regulators/assessing-point-load-regulators-using-non-invasive-techniques
9. S.M. Sandler How to verify control loop design, EDN, October 30, 2013 http://www.edn.com/design/pc-board/4423589/How-to-verify-control-loop-design
10. S.M. Sandler Troubleshooting Distributed Power Systems: Using Current Injectors,How2Power.com, Oct. 2013 http://www.how2power.com/newsletters/1310/index.html#Story3
