Members can download this article in PDF format.
What you'll learn:
- How to assess TDECQ measurement accuracy.
- Methods for acquiring data to determine accuracy.
- How does the type of instrumentation impact TDECQ measurements?
- Verification of the test setup for TDECQ.
Defining TDECQ
TDECQ, the acronym for “transmitter dispersion and eye closure quaternary,” is the primary metric used to gauge the quality of an optical PAM4 transmitter. It’s a power penalty metric that determines how much extra power is required at the receiver, from the transmitter, relative to an ideal transmitter, to achieve the required symbol error ratio (SER).
That extra power is necessary to compensate for both non-ideal transmitter waveforms and the impact of chromatic and/or modal dispersion. It’s like the transmitter dispersion penalty (TDP) metric used in non-return-to-zero (NRZ) optical communications standards. It was developed in the IEEE 802.3bs standard project and improved and modified in the IEEE 802.3cd, cu and db standards. It’s currently being refined again in the IEEE 802.3dj project.
The TDECQ method provides a convenient way to specify the performance of a PAM4 transmitter. TDECQ aggregates many transmitter attributes into a single metric, and it directly indicates the impact of a transmitter’s imperfections on overall system-level performance.
The step-by-step process to perform a TDECQ measurement can depend on the specific oscilloscope vendor,1 but the method is explicitly documented in clause 121 of IEEE 802.3. In summary:
- Acquire the pattern-locked waveform for the short stress pattern random quaternary (SSPRQ)2 pattern with an oscilloscope channel configured in a TDECQ reference receiver bandwidth appropriate for the transmitter data rate.
- Pass the waveform through the virtual TDECQ equalizer/receiver.
- Perform the TDECQ measurement, with equalizer tap-weights automatically adjusted to yield the minimum observed TDECQ penalty.
TDECQ Measurement Accuracy and Uncertainty
Assessing the accuracy of a TDECQ measurement is complicated. There’s no national-laboratory-based TDECQ standard reference signal for determining the accuracy of a TDECQ measurement system. Thus, there’s no TDECQ measurement accuracy specification in oscilloscope datasheets. However, it’s possible to determine the repeatability of TDECQ analysis and the relative accuracy of test systems.
As stated above, the intent of the TDECQ measurement is to assess the impact transmitter impairments have on a link budget. The TDECQ method effectively compares a transmitter’s performance to a virtual ideal transmitter having the same modulation power as the signal under test. An ideal signal (no eye closure) anchors the definition of 0 dB.
Should a high-quality transmitter expect to approach a 0-dB TDECQ value? This could be true, but the answer is complicated. The bandwidth of the TDECQ oscilloscope channel is set to half of the baud rate.
For example, a 53-Gbaud “100-Gb/s” transmitter is observed in a 26.56-GHz bandwidth. An ideal signal passed through the half-baud bandwidth, without the benefit of equalization, will incur some intersymbol interference (ISI), resulting in a TDECQ of approximately 0.8 dB. (802.3 TDECQ limits have been compensated to account for this).
Also consider that the waveform from the transmitter is passed through a virtual equalizer, which can mitigate impairments, including the reduced bandwidth oscilloscope channel. This could significantly improve the signal, including some removal of the oscilloscope-channel-induced ISI, but obscures what’s implied by a 0-dB TDECQ value.
In practice, TDECQ values observed directly from transmitters are typically in the 1- to 2-dB range. This typical value has more practical meaning than the theoretical ideal of 0 dB in that experienced users of TDECQ measurement systems target a TDECQ value between 1 and 2 dB.
Assessing TDECQ Measurement Accuracy
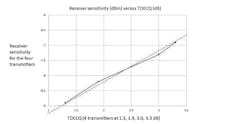
One way to assess the practical accuracy of a TDECQ measurement would be to observe the measured transmitter in a real system. If one transmitter has a TDECQ of 1.5 dB and a second transmitter has a TDECQ of 2.2 dB, we would expect the system receiver sensitivity, measured at a SER of 4.8e-4 (the SER used to determine TDECQ), to be 0.7 dB higher when the first transmitter is used, compared to when the second transmitter is used.
The change in TDECQ should be the same as the change in receiver sensitivity. This type of experiment has been conducted and contributed to the IEEE 802.3 cd project3 and the IEEE 802.3dj project4. In both reports, a close 1:1 relationship between TDECQ and receiver sensitivity is generally observed (Fig. 1).
Two important points should be made. First, the receivers used in the referenced experiments were similar in design to the virtual receiver used in TDECQ analysis, with equalizers slightly longer than the IEEE 802.3 5 tap TDECQ equalizer. Second, the comparisons are for relative and not absolute values of TDECQ. Real receivers used today likely tolerate signal impairments better than the virtual receiver used for TDECQ, with continual improvements to compensate for transmitter imperfections. The result is that TDECQ may be a conservative estimate of transmitter performance when used in a real system.
TDECQ measurements have been available and in a stable form since 2017. Oscilloscope solutions that perform these measurements are commonly called DCAs (digital communications analyzers) and have been used extensively over that time. They effectively provide industry-recognized standard reference measurements. It’s useful to document and avoid the mechanisms and situations that can degrade TDECQ measurement accuracy to ensure the best possible results are achieved.
Strategies for Acquiring the Data
The time required to perform the TDECQ measurement is based on three primary components: acquiring the transmitter waveform, optimizing the tap weights of the TDECQ virtual equalizer, and performing the TDECQ analysis.
The time required to acquire a waveform is based on the oscilloscope sample rate, the number of symbols in the test pattern or pattern length, and how many samples are acquired for each symbol. A common sampling oscilloscope sample rate is 250 ksamples/s. TDECQ is specified to be tested using the SSPRQ test pattern, with a length of 65,535 symbols. Then, the only variable for acquisition time is the number of samples per symbol or unit interval (UI). While not intuitive, the samples/UI should not be an integer value.
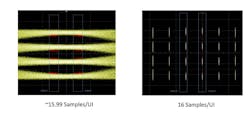
If the samples/UI value were an integer value, such as 16, the eye diagram created by overlaying all of the samples into a single UI would have all samples positioned at the same 16 locations across the eye diagram. This would result in minimum gaps of 1/16 UI between adjacent samples.
Consider that TDECQ is normally performed with histogram widths only 1/25 UI wide as specified by IEEE 802.3. Data gaps could result in significant measurement variation. Obviously, this could be mitigated by setting the samples/UI value to a very large number, but its’ at the expense of test time.
A more efficient approach is to set the samples/UI to a non-integer value. The resulting eye diagram aggregated from the long waveform pattern has a very high density with effectively no gaps. This allows for accurate TDECQ analysis through acquisition of just a single waveform. In Figure 2, the DCA is set to both 15.99000534 samples/UI and 16 samples/UI. (The product of the SSPRQ pattern length and the non-integer samples/UI is 1,047,905, the total number of samples in a single waveform acquisition.)
The time to acquire a waveform for TDECQ analysis, with the non-integer sample/UI, is typically in the 2- to 5-second range. The TDECQ measurement also requires the virtual equalizer tap values to be optimized to minimize the reported TDECQ penalty, which can be achieved in less than one second.
Once the waveform has been acquired and the tap weights optimized, the time required to assess the TDECQ penalty is almost instantaneous. The total test time to perform a TDECQ measurement, including waveform acquisition, equalizer optimization, and analysis, should be on the order of five seconds or less.
TDECQ Analysis on Low-Power Signals
TDECQ is designed to maintain good accuracy in the presence of noise, specifically noise from the DCA. DCA channel noise is measured directly and accounted for in the TDECQ calculation (see 802.3 clause 121.8.5.3 equation 121-11, where ss represents the noise of the oscilloscope). TDECQ should not change when reducing a signal level. If a signal is attenuated, TDECQ signal versus signal power should be constant.
However, there’s a limit to how much a signal can be attenuated before the measured TDECQ changes. The TDECQ calculation assumes some noise margin and eye opening. If the DCA channel noise is large relative to the transmitter signal power, the process of adding virtual noise (802.3 121.8.5.3 paragraph 5) begins to fail.
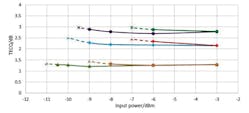
Initially, the reported TDECQ value begins to increase (Fig. 3), and when the noise is too large, the DCA will report an infinite penalty (noted as “SER?”). The signal power level at which this occurs depends on both the noise of the DCA channel and the quality of the transmitter. If TDECQ is low, measurements can be made at lower powers than when a transmitter with high TDECQ is analyzed.
TDECQ measurement algorithms have been updated to improve accuracy under low-power conditions to extend the low-power limits of the DCA. The easiest way to determine if TDECQ is being impacted by power level is to attenuate the signal and observe if the TDECQ value changes. (Example: The transmit power is split to various pieces of test equipment and can be temporarily routed for full power to the DCA to determine the baseline TDECQ value. How low can the power level be attenuated before the reported TDECQ begins to drift up?)
The Impact of Instrumentation Hardware on Accuracy
TDECQ instrumentation can impact measurement results. An incorrect frequency response may alter the waveform shape and yield incorrect measurements. Since TDECQ is a pattern-locked measurement (the DCA is synchronized to the pattern repetition rate), any imperfections in the hardware frequency response can be corrected in post-processing.
TDECQ is defined using a test system that derives a timing reference from the signal being observed. This is achieved with a clock-recovery (CR) system. The CR loop bandwidth is set to a value that effectively removes all jitter below 4 MHz from the observed signal.
Because the CR function is commonly achieved through hardware, it’s important to realize that the process of extracting a clock may not be ideal. This is especially the case in high stress conditions such as when the signal has passed through high dispersion fiber, is very low power, or both from traversing a long span of fiber. If the recovered clock is distorted in any way, it can be manifested as distortion in the acquired waveform and increased TDECQ measurement error. However, this type of distortion is systematic and can therefore be corrected with advanced calibration techniques.
Is a Lower TDECQ Value Always a More Accurate Value?
A common belief is that TDECQ error mechanisms always result in TDECQ values that are larger than the true result. This isn’t always the case. While it’s true that most of the mechanisms that degrade accuracy increase the TDECQ value, it’s possible certain errors will decrease the value.
One common scenario is reduced TDECQ through improper noise processing in the TDECQ virtual receiver. Transmitter noise will “close the eyes” and when analyzed correctly, increase the TDECQ value. If the signal noise and jitter aren’t managed correctly through the receiver, they can be suppressed, leading to an incorrectly reduced TDECQ value.
This is easy to observe by creating a signal where noise can be sequentially increased, such as with an arbitrary waveform generator. As the noise increases, TDECQ should increase. Incorrect systems will report little or no change in TDECQ when signal noise is intentionally increased.
Verify the TDECQ Measurement Setup
TDECQ is often measured on transmitters with closed eyes that are still considered good when configured with equalizing receivers. When setting up the TDECQ measurement, it can be hard to recognize when the test system isn’t configured correctly, as the eye diagram waveform observed for a bad setup can be hard to distinguish from one seen with a good setup. A good waveform measured in a bad setup will yield a bad TDECQ metric!
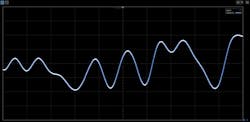
It's easy to do a quick sanity check to verify that the test system is set up correctly. Before any measurements are made, simply look at the signal as a pattern waveform rather than an eye diagram (Fig. 4).
Switching out of an eye-diagram mode, the waveform should appear as a stable sequence of symbols. The signal must be stable over the entire pattern acquisition, typically 3 to 5 seconds. The waveform pattern must have a single amplitude value for every point in time. If there’s drift in the signal level, excessive edge jitter, or excessive noise, something is likely wrong in the setup. As a result, TDECQ analysis will likely fail. Correct the problems to produce the stable pattern waveform before attempting the TDECQ analysis.
TDECQ is likely to remain the primary metric for PAM4 transmitters for years to come. Work is underway to define 800G and 1.6T systems and TDECQ is again being used to define transmitter performance. With a little practice and the right equipment, accurate TDECQ measurements can be made with confidence.
References/Notes
1. A useful example can be found in “TDECQ Part 1: Making Accurate and Repeatable Compliance Measurements.”
2. The SSPRQ is a pattern designed to emulate real data traffic, but with a 2^16-1 length compared to the PRBSQ31 pattern at 2^31 in length.
3. https://grouper.ieee.org/groups/802/3/cd/public/July18/tamura_3cd_01c_0718.pdf
4. https://grouper.ieee.org/groups/802/3/dj/public/23_09/lecheminant_3dj_01b_2309.pdf
“TDECQ (Transmitter Dispersion Eye Closure Quaternary) Replaces Historic Eye-mask and TDP Test for 400 Gb/s PAM4 Optical Transmitters,” King, Leyba, LeCheminant, OFC 2017.
“BER and TDECQ Correlation for Different Impairments in 400Gbps PAM4 System,” Zhao, Doerr, Chen, Zhu, Ton, Aroca, Huang, and Xu, OFC 2020.
