Negative feedback is used in voltage regulators, point-of-load (POL) regulators, voltage references, operational amplifiers (op-amps), and other electronic circuits in order to produce an accurate output in response to an input. In the case of a voltage regulator, the input is an accurate voltage reference and negative feedback is used to compare a sample of the output to the reference. The difference, or error signal, is amplified and used to correct the output. If the feedback loop is stable, then the output converges to the correct voltage. If the feedback loop is not stable, then the output diverges or results in a sustained oscillation. The performance within this range of convergence and divergence is a function of the stability margins (SMs).
Related Articles
- Five Things Every Engineer Should Know About Bode Plots
- Evaluate Feedback Stability When There’s No Test Point
- Auto Compensation Enhances Power Supply Designs
- When Bode Plots Fail Us
- Understanding Power Integrity as a System-Wide Challenge
- Extracting Bode Plots from Output Impedance
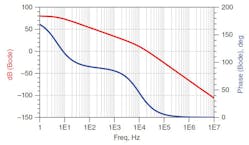
The relative stability is traditionally determined from an openloop Bode (gain-phase) plot in the frequency domain. The phase margin (PM) is equal to 180 degrees minus the phase shift measured at the circuit’s open-loop crossover frequency (0-dB point), whereas the gain margin (GM) is the gain when the phase crosses 0 degrees. In space applications, where fidelity is critical, an end-of-life phase/gain margin of 30 degrees/10 dB is usually the absolute minimum requirement.
The stability of the control loop matters because poor stability degrades output noise, power supply rejection ratio (PSRR), reverse transfer, output impedance, and step load response. These localized degradations result in further system performance degradation including clock jitter, reduced signal-to-noise ratio (SNR), and bit error rate (BER) to name a few. It is for these reasons that we are so concerned with the stability of all control loops.
The datasheets for linear regulators, POL regulators, and voltage references rarely provide the necessary information to produce a stable design and therefore measurement is a necessity.
Control Loop Basics
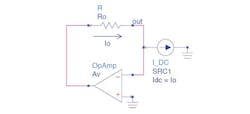
The goal of most circuits is to produce a clean and well-defined output for a given input. The output is generally controlled by an amplifier gain loop that compares the output with an input signal. The difference or error voltage is amplified. This amplified signal is then used to control the output. The accuracy of the closed-loop output can be calculated from the performance without the amplifier loop. A simple amplifier feedback circuit is shown in Fig. 8.1.
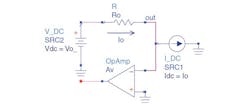
If the feedback loop is removed and a fixed 0 V is connected in place of the amplifier output, as shown in Fig. 8.2, then the open-loop output voltage changes dependent on the output current, Io, as in Eq. (8.1):
If the feedback amplifier is inserted in the loop, then the amplifier will increase the voltage at the output by the amplifier gain Av. Since no current flows into or out of the amplifier inputs, the current through Ro must be equal to the output current, Io:
Solving for the closed-loop output voltage, which is equal to the inverting input voltage, results in
If the loop gain incurs a 180-degree phase shift at unity gain, Av is equal to negative one and the denominator becomes zero resulting in an infinite output. This is the definition of oscillation. It can be seen in Eq. (8.3) that for values of Av close to, but not exactly, negative one, the closed-loop response is greater than the open-loop response. This also holds true for all noise paths discussed in Chap. 6. As Av approaches negative one, all noise paths are degraded. If it is equal to negative one, the circuit will oscillate.
The relative stability is, therefore, a measure of the proximity of the total loop gain to the single point, which has unity gain and 180 degrees of additional phase shift within the loop.
Gain Margin, Phase Margin, Delay Margin, and Stability Margin
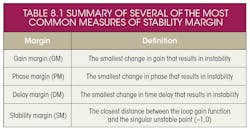
The most common measures of stability are gain margin, phase margin, and delay margin. The stability margin incorporates all other measures as summarized in Table 8.1.
In the assessment of the open-loop gain, the singular unstable point is located at (-1,0). If we include the negative feedback of the amplifier, this point is moved to the opposite side at (1,0). In this book, we include the amplifier feedback and so the convention used here is that the singular unstable point for the complete loop is at (1,0).
It is possible for higher-order control loops to have multiple stability margins. In this case, each of the margins must be assessed. In addition, many regulators have multiple loops working together. The overall stability of the device must at least include an assessment of the combined performance (all loops superimposed).
If the gain function is second order, there may not be a GM, only a PM. This is because a second order system incurs a maximum 180-degree phase shift, 90 degrees for each pole. The sum of the 180 degrees and the 180 degrees incurred due to negative feedback is exactly 0 degrees, thus there is no point at which the phase crosses through 0 degrees. This is shown using a simulation in Fig. 8.3.
Bode Plots and Nyquist Charts
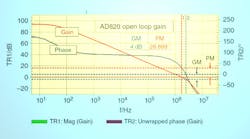
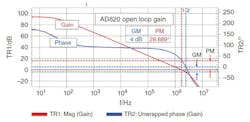
There are many methods of assessing stability, including Routh-Hurwitz, Root Locus, Nyquist, Nichols, and Bode. The most popular is the Bode plot, most likely because it is simple to interpret, is usually an easy measurement to make, and the asymptotic diagrams can easily be hand drawn, allowing the use of the Bode plot to assist in designing a stable loop. A good example of the Bode plot is the operational amplifier open-loop gain and phase measurement shown in Fig. 8.4. Most op-amp datasheets include a figure similar to this.
The Bode plot assessment addresses stability using two margins, the gain margin and the phase margin. If both the gain margin and phase margin are greater than zero, then the circuit does not oscillate. The larger the margins are, the more stable the circuit is.
The PM in Fig. 8.4 is measured as 28.89 degrees using the red cursor, which is set to 0-dB gain. The gain margin is measured as 4 dB using the blue cursor, which is set to 0 degrees.
In actuality, almost all circuits are higher than second order due to high-frequency limitations in the transistors used to create the devices. The phase shift in Fig. 8.4 clearly falls far below 0 degrees indicating that there is at least one additional pole. Higher-order systems may have several GM and/or PM solutions in which case each GM and PM is independently assessed to assure stability.
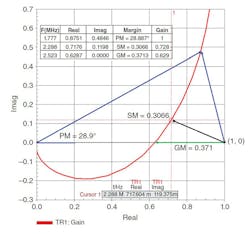
The Nyquist plot is a better method of stability assessment for higher-order systems. It is measured using the same method and instrumentation as the Bode plot. The operational amplifier Bode plot from Fig. 8.4 is shown as a Nyquist chart in Fig. 8.5. The Nyquist chart shows the open-loop gain as real (horizontal) and imaginary (vertical) terms. The singular unstable point in this case is at the point(1,0). The unstable point is shown on the right side of the graph. We often see it on the left-hand side at the point (-1,0) as stated above. The difference between these two conventions is whether the 180 degrees from negative feedback is included in the measurement. Since we measure the complete loop, which includes the 180 degrees for the negative feedback and the additional phase shift incurred within the loop, the unstable point is at the point (1,0).
In the Nyquist chart, the stability is assessed by the proximity of the loop gain function to the singular unstable point at (1,0). The gain margin is assessed as the length along the horizontal axis between the unstable point at (1,0) and the curve as shown in the green arrow, indicating a gain margin of 0.371. The gain at this point is (1 - 0.371), or 0.629, which is -4 dB. The phase margin is assessed as the angle formed by the horizontal axis and the unity gain length connection from the point (0,0) to the loop gain curve. The stability margin is defined by the closest distance between the unstable point at (1,0) and the loop gain curve.
The distance from any point along the loop gain curve to the singular unstable point (1,0) can be calculated as:
Applying this to the phase margin measurement the distance from the point (1,0) is:
The gain at any point along the loop gain curve is calculated as:
Applying this to the point at which the PM is assessed we get:
This confirms that this is the unity gain length connection between (0,0) and the loop gain curve. The phase angle formed by the unity gain length connection and the horizontal axis is calculated from:
Applying this to the point at which the PM is assessed we get:
The gain margin is calculated directly from the length along the horizontal axis as:
GM= (1− 0.371) = 0.629 = 4 dB (8.10)
The results of Eqs. (8.9) and (8.10) confirm that the Nyquist chart assessment provides the same GM and PM as the Bode plot. Fig. 8.5 also shows us that SM result is less stable than either the GM or the PM.
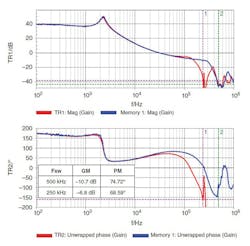
In some cases, the circuit adds a time delay, either due to sample and hold functions, such as in a digitally controlled power supply, or due to the discrete-time nature of switching power supplies. While different topologies yield different performance, the result is that as the frequency approaches the sampling rate, or switching frequency, additional phase shift is incurred while the gain remains unchanged. This effect is clearly illustrated in the Bode plot measurements shown in Fig. 8.6. The DC/DC converter being tested is measured with the switching frequency set for 250 kHz in the red traces and 500 kHz in the blue traces. The transfer function at low frequencies is relatively unaffected. At higher frequency, the slope of the gain does not significantly increase, though the phase curve rolls off quickly incurring an additional 180-degree phase shift at the switching frequency.
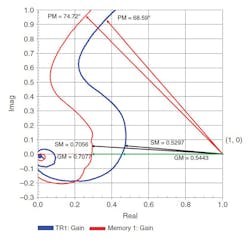
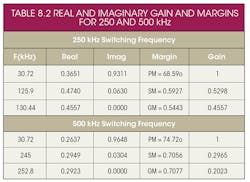
The same measurement data is displayed as a Nyquist chart in Fig. 8.7. In the Nyquist chart, it is obvious that the stability is reduced at the 250-kHz switching frequency since the entire curve shifts toward the singular unstable point (1,0). At the control loop bandwidth of 30.72 kHz, the time delay has an effect on the PM as evidenced by the reduction from 74.7 degrees at 500 kHz to 68.6 degrees at 250 kHz. The closest distance between the unstable point at (1,0) and the loop gain curve is shortest at the SM in both cases, and not the GM or PM, again showing that the SM is a better assessment of relative stability.
The real and imaginary gain terms are extracted from the vector network analyzer (VNA) measurement. These terms are used to calculate the PM, GM and SM, as well as the gain magnitude. The results are shown in Table 8.2. Note that the gain at the PM is unity.
Excerpted from Power Integrity by Steve Sandler (McGraw-Hill Education; 2014) with permission from McGraw-Hill Education.
