The mathematics behind the non-invasive measurement was incorporated into the OMICRON Lab Bode 100 VNA software, sold by Picotest.com, starting in late 2011. The solution was included as a single cursor based measurement utilizing a piecewise linear approximated solution. The approximate solution is most accurate below 40 degrees, while the method is capable of accurately determining phase margins up to nearly 70 degrees.
Related Articles
- Five Things Every Engineer Should Know About Bode Plots
- Five things every Engineer should know about PDN
- Steve Sandler Answers Your PSRR Questions
- Understanding Voltage Response Of An LC Circuit
- Fast Current Injector Beats E-Load in POL Testing
Thanks to the completion of a license agreement with OMICRON Lab, the Bode Analyzer Suite V2.43 now includes the exact solution, improving the accuracy for measurements at higher phase margin values. While there are small measurement errors due to interpolation, measurement noise, and even the accuracy of the Bode plot measurement, the Bode and non-invasive results are generally within 1 degree accuracy.
As noted in [1] , the phase margin can be determined from an output impedance measurement on a VNA, which is then converted to group delay. This is because the phase margin is related to the Q factor and through the group delay information a conversion can be made to phase margin.
One Cursor or Two
The new implementation now includes a two-cursor (newer, more accurate) measurement in addition to the one cursor (current method). This may present some confusion, but the measurement is still easy to perform and non-invasive. The determination as to whether to use one cursor or two is simple.
The new exact 2 cursor math is more precise and most accurate above approximately 40 degrees. At higher phase margins, the impedance peak and group delay Q peak tend to separate, and the separation is used to improve the accuracy of the result for higher phase margin conditions. Therefore, using one cursor still results in a very reasonable approximation, the second cursor simply improves the accuracy, especially at higher phase margin.
Example 1
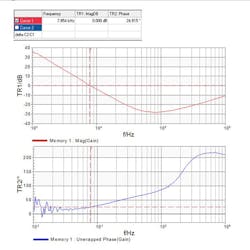
In this first example, a voltage regulator is paired with a ceramic capacitor resulting in a phase margin of approximately 25 degrees as shown in Fig. 1.
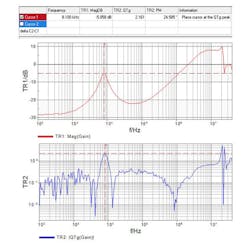
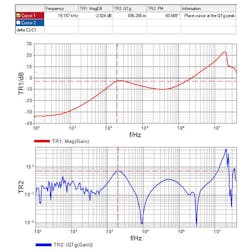
The output impedance and Q of the group delay for the same regulator operating in the same conditions is shown in Fig. 2. Note that since the phase margin is very low and the Q and impedance peaks occur at the same frequency. In this case, a single cursor measurement provides an accurate result and the two cursor measurement provides the exact same result.
Example 2
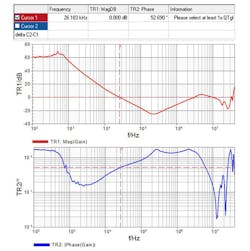
In this second example, the same voltage regulator is paired with a tantalum capacitor resulting in a phase margin of approximately 53 degrees as shown in Fig. 3.
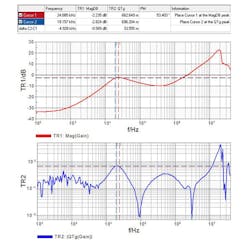
The output impedance and Q of the group delay for this condition is shown in Fig. 4. Since the phase margin is much higher the Q and impedance peaks occur at different frequencies. The result from a single cursor measurement is shown in Fig. 4. The non-invasive phase margin error is more than 10% in this case. The two cursor measurement result is shown in Fig. 5. Note that using two cursors the 2 cursor result is within approximately 1 degree of the Bode plot derived phase margin or better than 2 percent.
Error Terms
The errors between the Bode plot measurement and the non-invasive phase margin measurement are largely due to measurement tolerance errors, and, noise, as well as nonlinearities resulting from the introduction of the injection signals. Another source of error is the limitation of the number of data points used in the measurement. This error can be reduced by increasing the number of data points or by using the ZOOM mode to reduce the frequency range of the measurement so as to only include the two trace peaks.
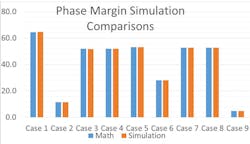
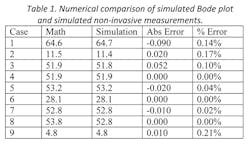
We can remove nearly all of these real life error terms by using a simulation model that allows the measurement of both the Bode plot and the non-invasive phase margin measurement. The only errors that exist in the simulation model are related to the number of data points assessed and the interpolation of data between data points. The results of nine simulation cases, spanning phase margins from 5 degrees to 65 degrees, are shown in Fig. 6. They clearly indicate that the basic methodology of deriving the phase margin from the output impedance yields the same result as the direct control loop assessment. The results of Fig. 6 are shown numerically in Table 1.
With the measurement tolerances, noise and any non-linearity related to the injection signal removed, the average error is reduced to an average of 0.07% or 0.1 degrees. This remaining error is the result of the limited number of data points in the simulation and the interpolation between data points.
Conclusion
The non-invasive phase margin measurement has proven itself to be an invaluable tool using the approximation technique. This improved version now provides an exact solution over a wide range of phase margins from less than 5 degrees to more than 65 degrees. The method does not require access to the control loop, which is often not even available. The noninvasive method works for voltage references, linear and switching regulators, opamps, input filters, and class D switching amplifiers. The only access required is to the device's output pin and ground, which are generally available. In the case of the regulators and voltage references, the output capacitor is a convenient location for the measurement.
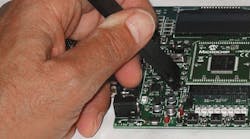
The upcoming release of the Picotest 1-port and 2-port PDN probes will further simplify the noninvasive assessment, including all of the necessary connections within a handheld probe.
References
1. New Technique for Non-Invasive Testing of Regulator Stability, Steven Sandler and Charles Hymowitz AEi Systems.com, Power Electronics Technology | September 2011
2. How to verify control loop design, EDN, Steve Sandler-October 30, 2013
3. Non-Invasively Assess Your Multiple-Loop LDO’s Stability, Steve Sandler, Electronic Design, Jan 7, 2014
4. http://www.aeng.com/power_integrity.htm
5. http://www.picotest.com/blog and http://www.aeng.com/design_analysis.htm
